Here is an interactive educational app for interpreting blood gases.
Some explanatory notes to accompany the app, given below.
Terms
aHCO3= actual bicarbonate = what the bicarbonate concentration is in the samplestdHCO3= what the bicarbonate concentration would have been if PaCO2 was normal (i.e. under standard conditions: T37, fully oxygenated, PaCO2 5.3 kPa)BE= base excess = the amount of strong acid that must be added to each liter of fully oxygenated blood to return the pH to 7.40 under standard conditions
Therefore, stdHCO3 and BE report the metabolic component of any disturbance, accounting for the interconversion of CO2 and HCO3.
Plots
The relationship between pH, PaCO2 and HCO3 is described by the Henderson-Hasselbalch equation and can be plotted in three dimensions:
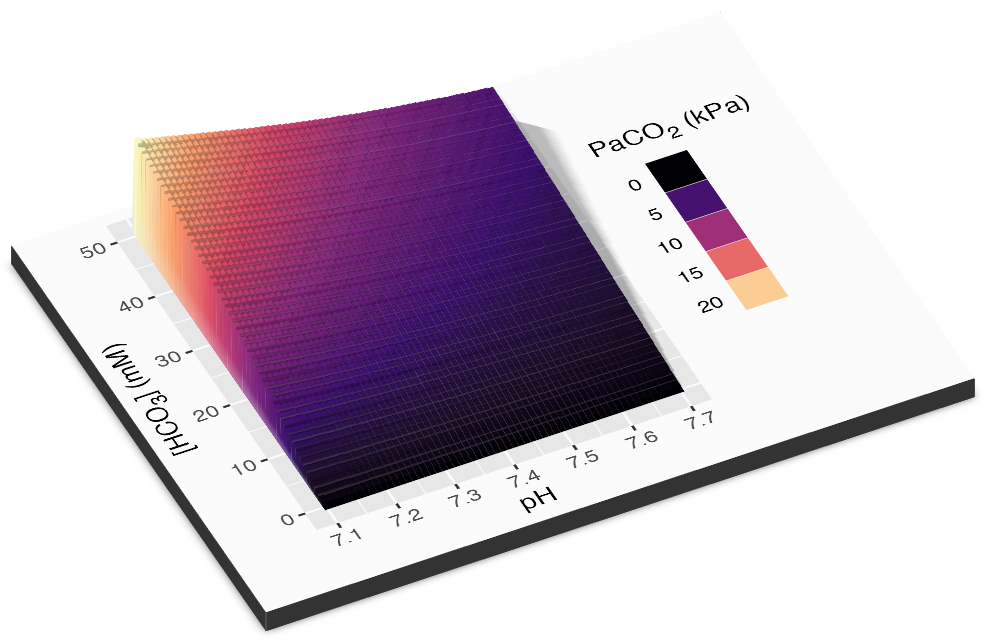
There are two methods used to project this on to two demensions. Horace Davenport (c. 1958, after van Slyke), plotted pH vs. HCO3 with PaCO2 isopleths. Siggaard-Andersen (Copenhagen, 1971) preferred plotting pH vs. PaCO2 with BE lines.
Compensation
The compensation lines for Davenport plots are drawn according to the following “Boston Rules” (Schwartz & Relman, NEJM 1963; Berend et al., NEJM 2014):
- acute respiratory acidosis: 1 mM rise in HCO3 per 10 mmHg rise in PaCO2
- acute respiratory alkalosis: 2 mM fall ditto
- chronic respiratory acidosis: 4 mM rise in HCO3 per 10 mmHg rise in PaCO2
- chronic respiratory alkalosis: 5 mM fall ditto
- metabolic acidosis: PaCO2 = 1.5 * HCO3 + 8 = ‘Winter’s formuala’ (Dell & Winters, 1967)
- metabolic alkalosis: PaCO2 = 0.7 * HCO3 + 20
For acute respiratory disturbances, compensation lines extended approximately along the dashed ‘van Slyke buffer line’.
The compensation lines for Siggaard-Andersen plots are drawn according to the following Severinghaus rules:
- acute respiratory disturbance: no change in BE
- chronic respiratory disturbance: BE changes by 0.4 * PaCO2
- metabolic acidosis: PaCO2 changes by 1 * BE
- metabolic alkalosis: PaCO2 changes by 0.6 * BE
Due to uncertainty around the accuracy of these rules, the lines are deliberately drawn without confidence intervals. (However, these are probably in the range of +/- 5 mM for bicarbonate response to respiratory perturbations.) There are limits to the extent to which compensation can occur, so the compensation curves are likely to flatten off at extremes (not shown on the app). For example, requirement for O2 exchange may limit the extent to which ventilation rate can be lowered to compensate for a metabolic alkalosis.